
Summit Platform - Release Notes

Welcome to an overview of recent updates, enhancements, and new features added to the OptConnect Summit platform. Check back regularly to stay informed about improvements that will help you monitor and manage your OptConnect devices more effectively.

June 2026 | Awareness Features

Overview: 

This release brings the full OptConnect Aware experience to Summit — flexible licensing so you can try Aware before you commit, richer environmental monitoring with charts and customizable thresholds, and a new layer of Aware Intelligence that learns each device’s normal behavior to surface what actually matters. It also introduces Aware Rapid View for live, second-by-second visibility during security and environmental events, plus smarter notification controls. Features below are rolling out beginning June 24, 2026.
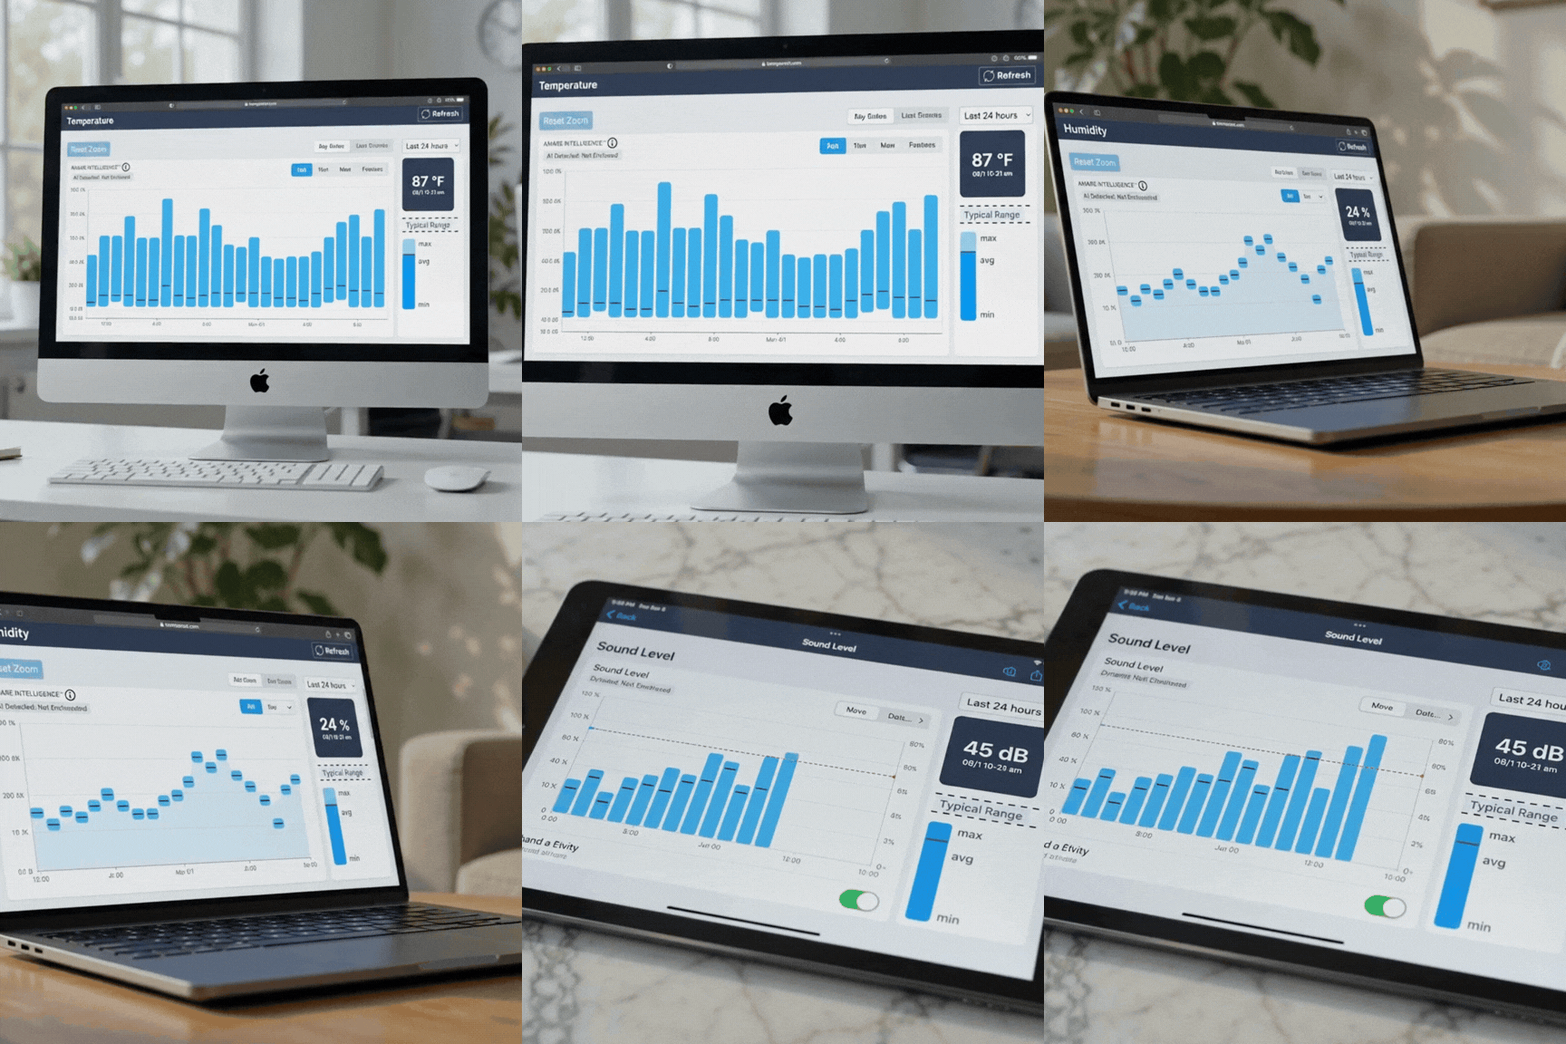
Environmental Monitoring & Thresholds

  • Temperature & Humidity Charts – Visualize thermal and moisture performance over time to keep assets within safe operating conditions.
  • Light Sensor Charts (Top & Bottom) – Spot unauthorized access, tampering, or positional changes by tracking light-exposure trends.
  • Sound Chart – Visualize noise levels to identify operational anomalies or unauthorized activity around the device.
  • Custom Thresholds – Set alerts to match the specific safety limits of your environment, reducing noise from irrelevant warnings.
  • Threshold Change History – Audit who changed threshold settings and when, for accountability and easier troubleshooting.
  • Temperature & Humidity Email Alerts – Receive proactive warnings about environmental risks the moment they occur, so you can act before damage is done.

Aware Intelligence

  • Smart Temperature & Humidity Thresholds – “Set it and forget it” monitoring that automatically adapts to each environment, catching true outliers without manual tuning.
  • Intelligent Anomaly Alerts – Get email alerts only for statistically significant deviations, reducing alert fatigue from minor fluctuations.
  • Light Behavior Forecasting – Learn normal access patterns — like standard restocking times — so alerts fire only on genuinely unusual activity.
  • Forecast-Based Light Alerts – Aware Intelligence compares the device’s open/closed state against its forecast to narrow notifications down to the ones that need attention.
  • Installation-Aware Models – Capture installation context during setup (for example, “is this enclosed?”) and apply device labels so the intelligence understands each device’s physical environment and alerts more accurately.
  • Anomaly Highlights on the Overview – Automatically surface irregular temperature, humidity, or motion patterns in historical data — no manual alert configuration required.

Aware Rapid View

  • Rapid View Live – Watch security and environmental events unfold in real time with second-by-second data updates to manage active situations.
  • Rapid View Replay – Investigate past incidents with granular, second-by-second detail to determine root cause and liability.
  • Rapid View Session History – Browse recent Rapid View sessions and jump back into any one to review the details.
  • Session Analysis – A quick, Aware Intelligence–generated summary tells you what happened leading up to a session, saving review time.
  • Rapid View Start Notifications – Know immediately, in Summit and by email, when a device enters high-frequency reporting after a physical security event.
  • Critical Alerts – Get instant in-Summit warnings of hardware-threatening conditions such as battery faults or extreme heat, before a device fails.

Notification Controls

  • Batched Notifications – Take control of your inbox by batching notifications, while still letting the message types you choose come through immediately.
  • Active Power Outage Notifications – Get alerted when a device has been in an extended power-out state beyond a threshold you define.

Overview: 

Available for customers of neo2 aware, max aware, mylo2, and the latest version* of neo2, new Network Tools are now available in Summit, providing additional visibility into device signal, upload / download speeds, troubleshooting, network behaviors, IP address status, link speeds, and client data usage.

*NOTE: An updated version of neo2 began shipping mid-2024. Some neo2 customers using a different version will not see the new tools.

OptConnect wireless device monitoring dashboard for network performance and connectivity.

Network Tools:

  1. Ping – Confirms reachability and basic responsiveness. An inbound ‘ping to’ confirms the device is powered on, reachable over the network, and about to allow inbound traffic. An outbound ‘ping from’ confirms that the device has an active connection, a valid IP address, and the ability to reach external endpoints.
  2.  Speed Test – Measures upload and download speeds from the device to the network, helping confirm available bandwidth and validate connection performance at a specific moment in time.
  3. Event Logs – System-level logs show how the device is managing network interfaces, wireless behavior, and DCHP / DNS services. This tools is useful for advanced troubleshooting, including diagnosing edge cases or unusual behavior. It is unlikely to be used daily.
  4. Packet Capture – Captures raw network packets and shows exactly what traffic is moving through the device. This advanced feature requires additional technology for viewing (e.g., Wireshark) and is best suited for experienced network teams.
  5. DHCP Reservation – Ensures a specific device always receives the same local IP address. Applications stay predictable on the local network, with no guessing where devices ‘live’ after reboots or reconnects.
  6. Link Speeds – Measures Ethernet link speed between the router and connected devices, helps identify cabling / port / hardware bottlenecks, and can be a useful (and often overlooked) factor in measuring performance. 
  7. Client Data Usage – Breaks down data usage by connected device, shows which clients are consuming the most data, and helps control costs by spotting unexpected behavior. The device can store up to 40 days of daily usage data.